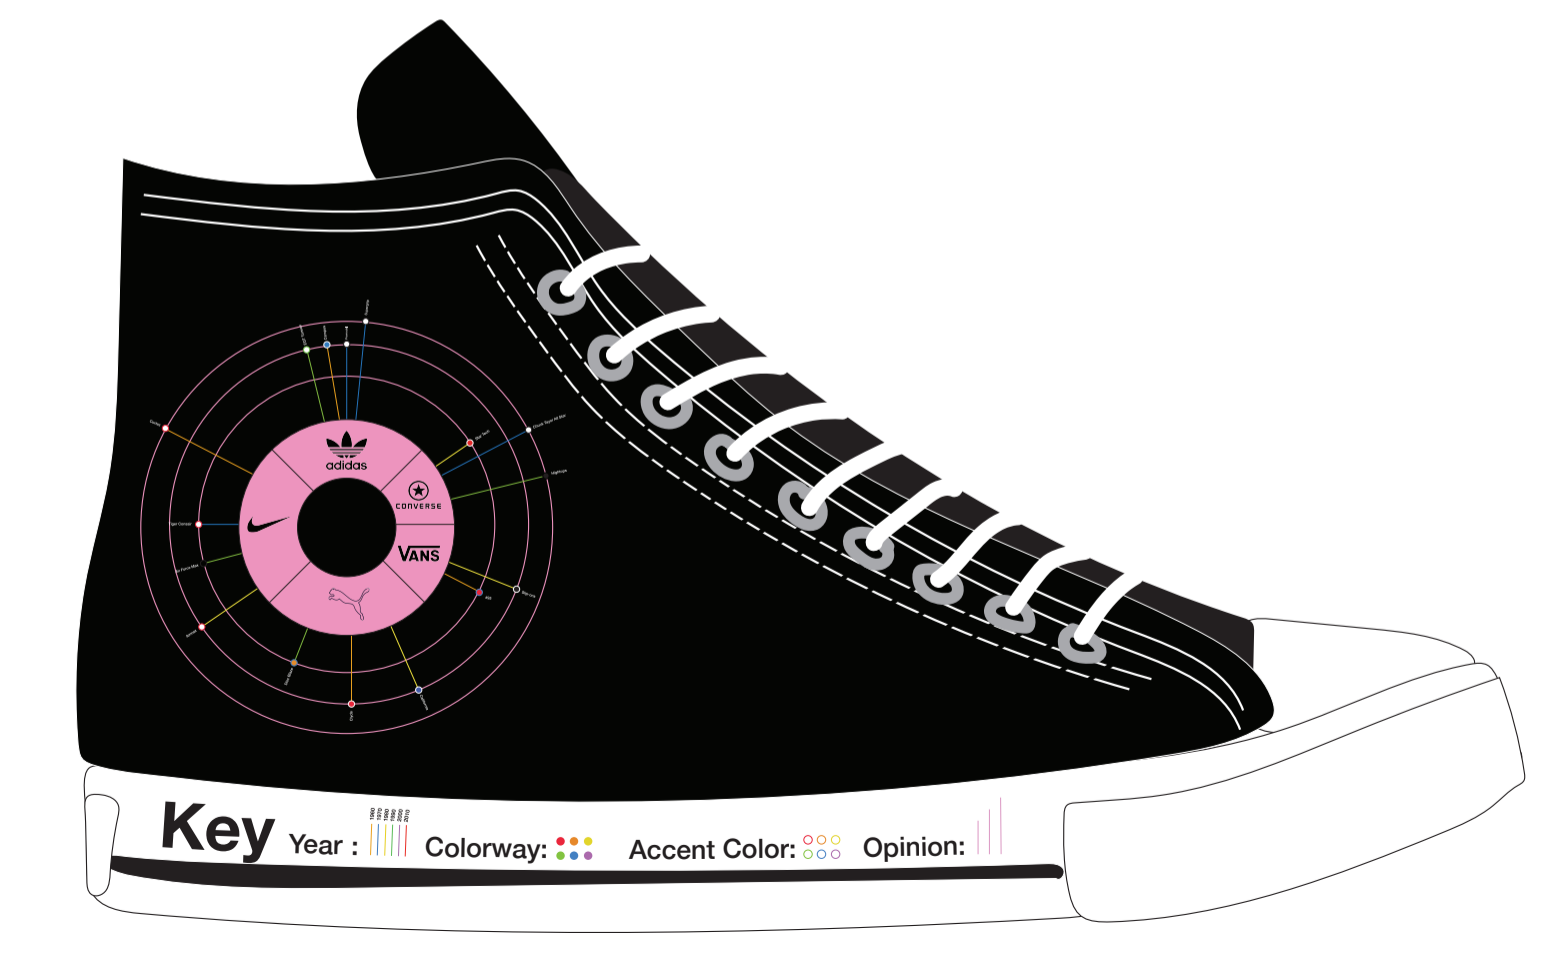
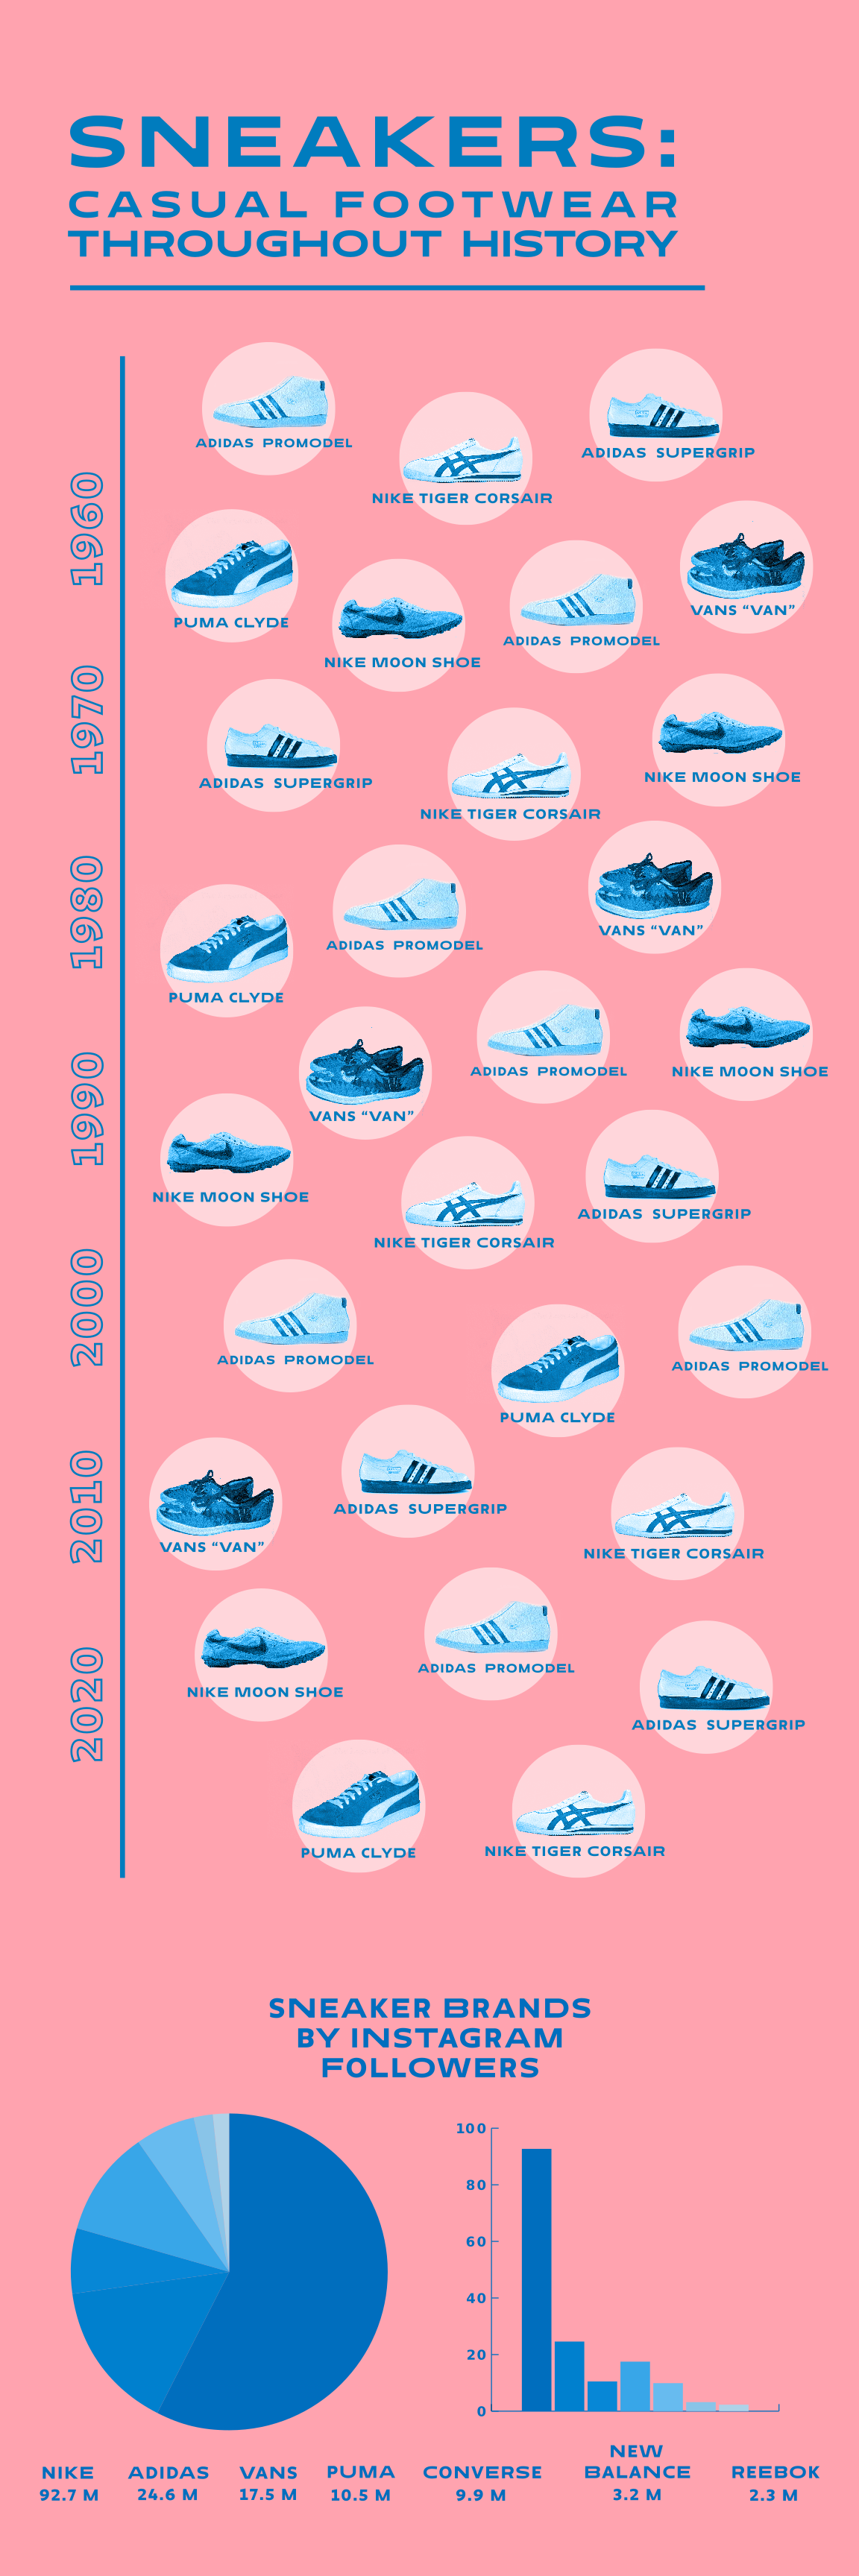
In my Intermediate Graphic Design course, I was tasked with creating an infographic for a topic of my choice using at least 50 data points.
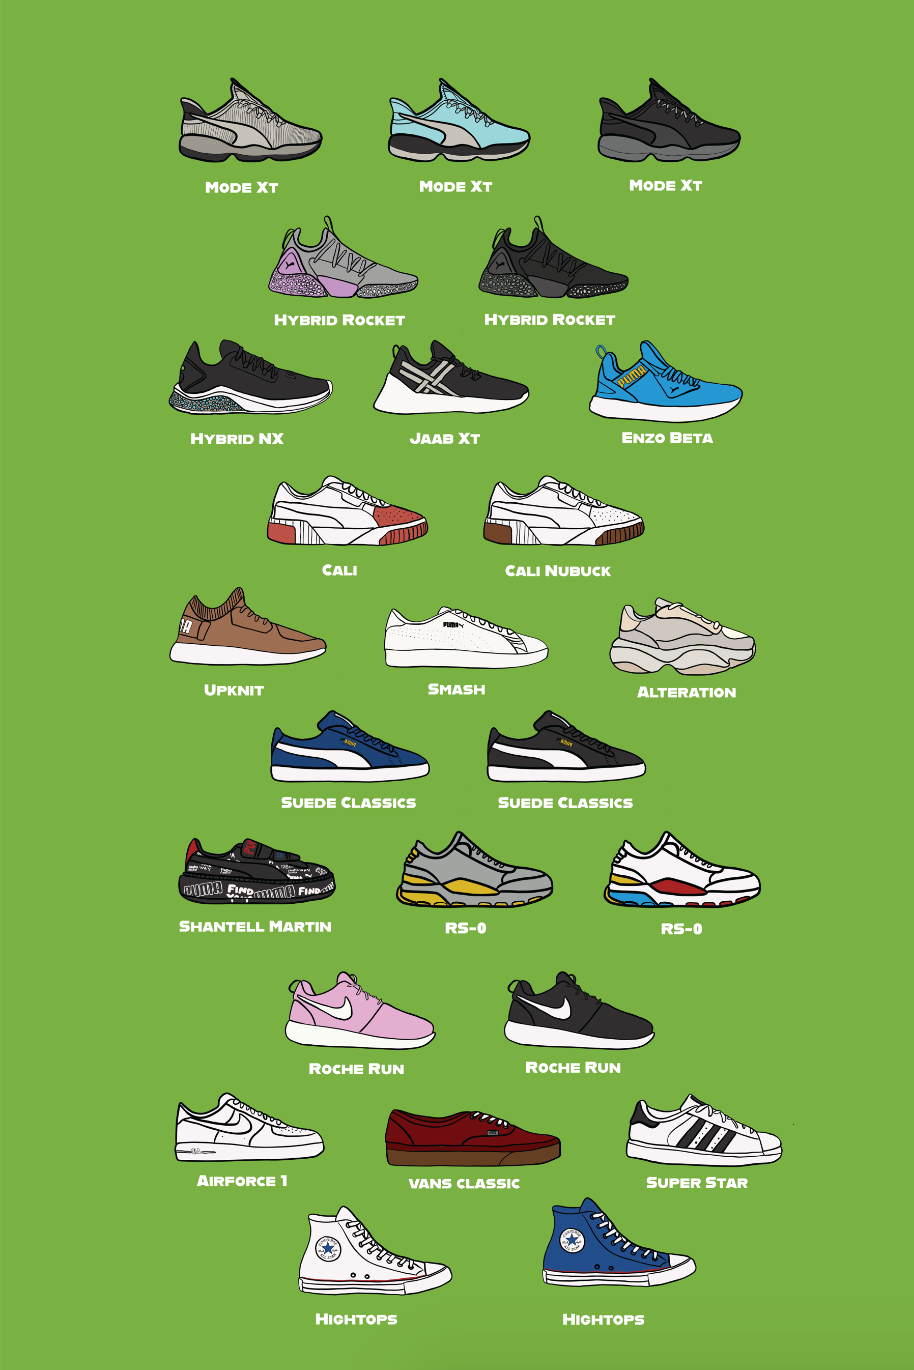
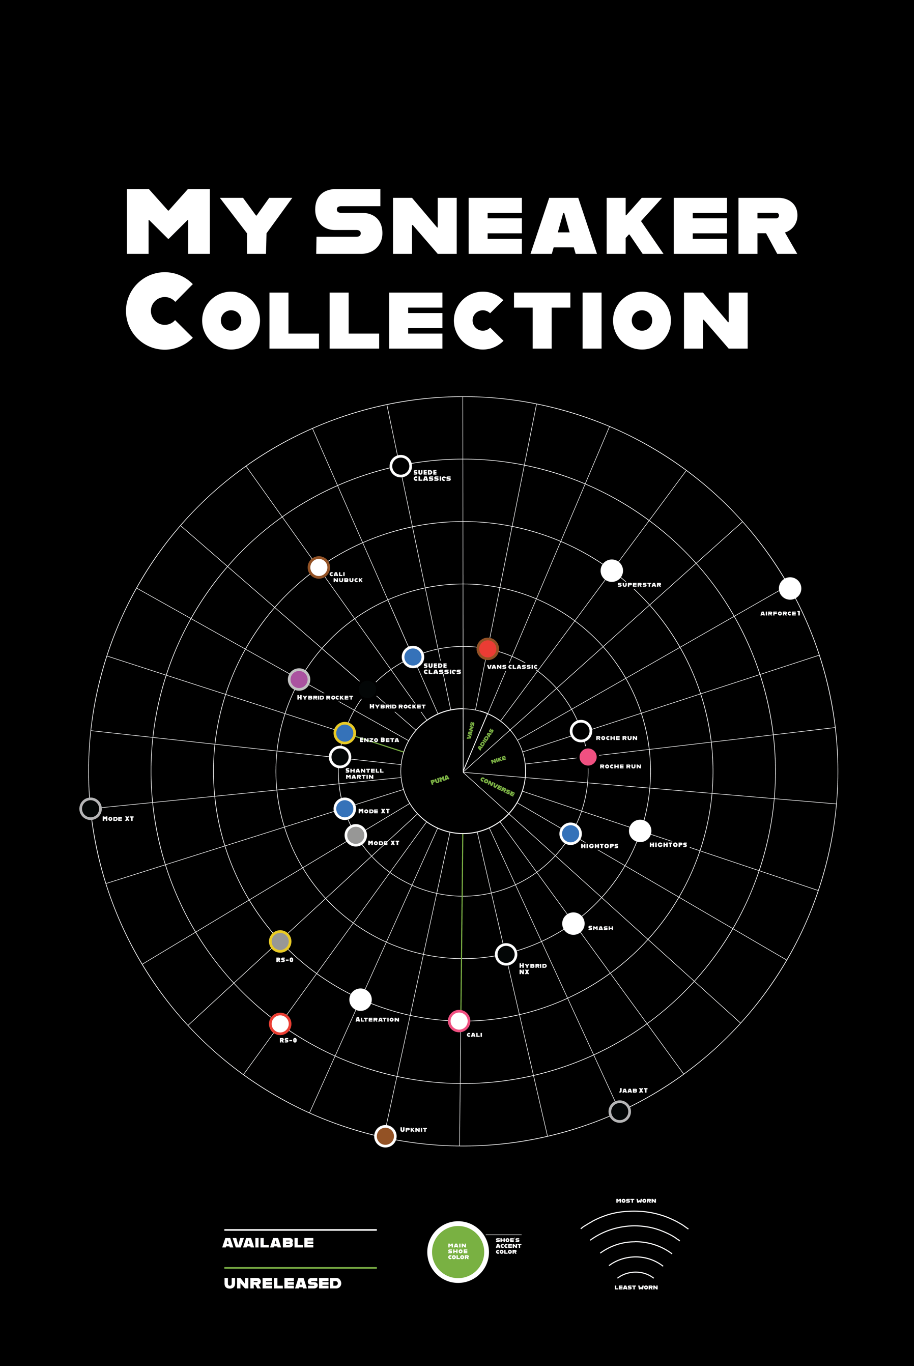
When I started this project, I knew I wanted to make the focus sneakers, but when I began it was more centered around the history of sneakers. This topic was difficult to find hard data, so I shifted the focus to be my personal sneaker collection.
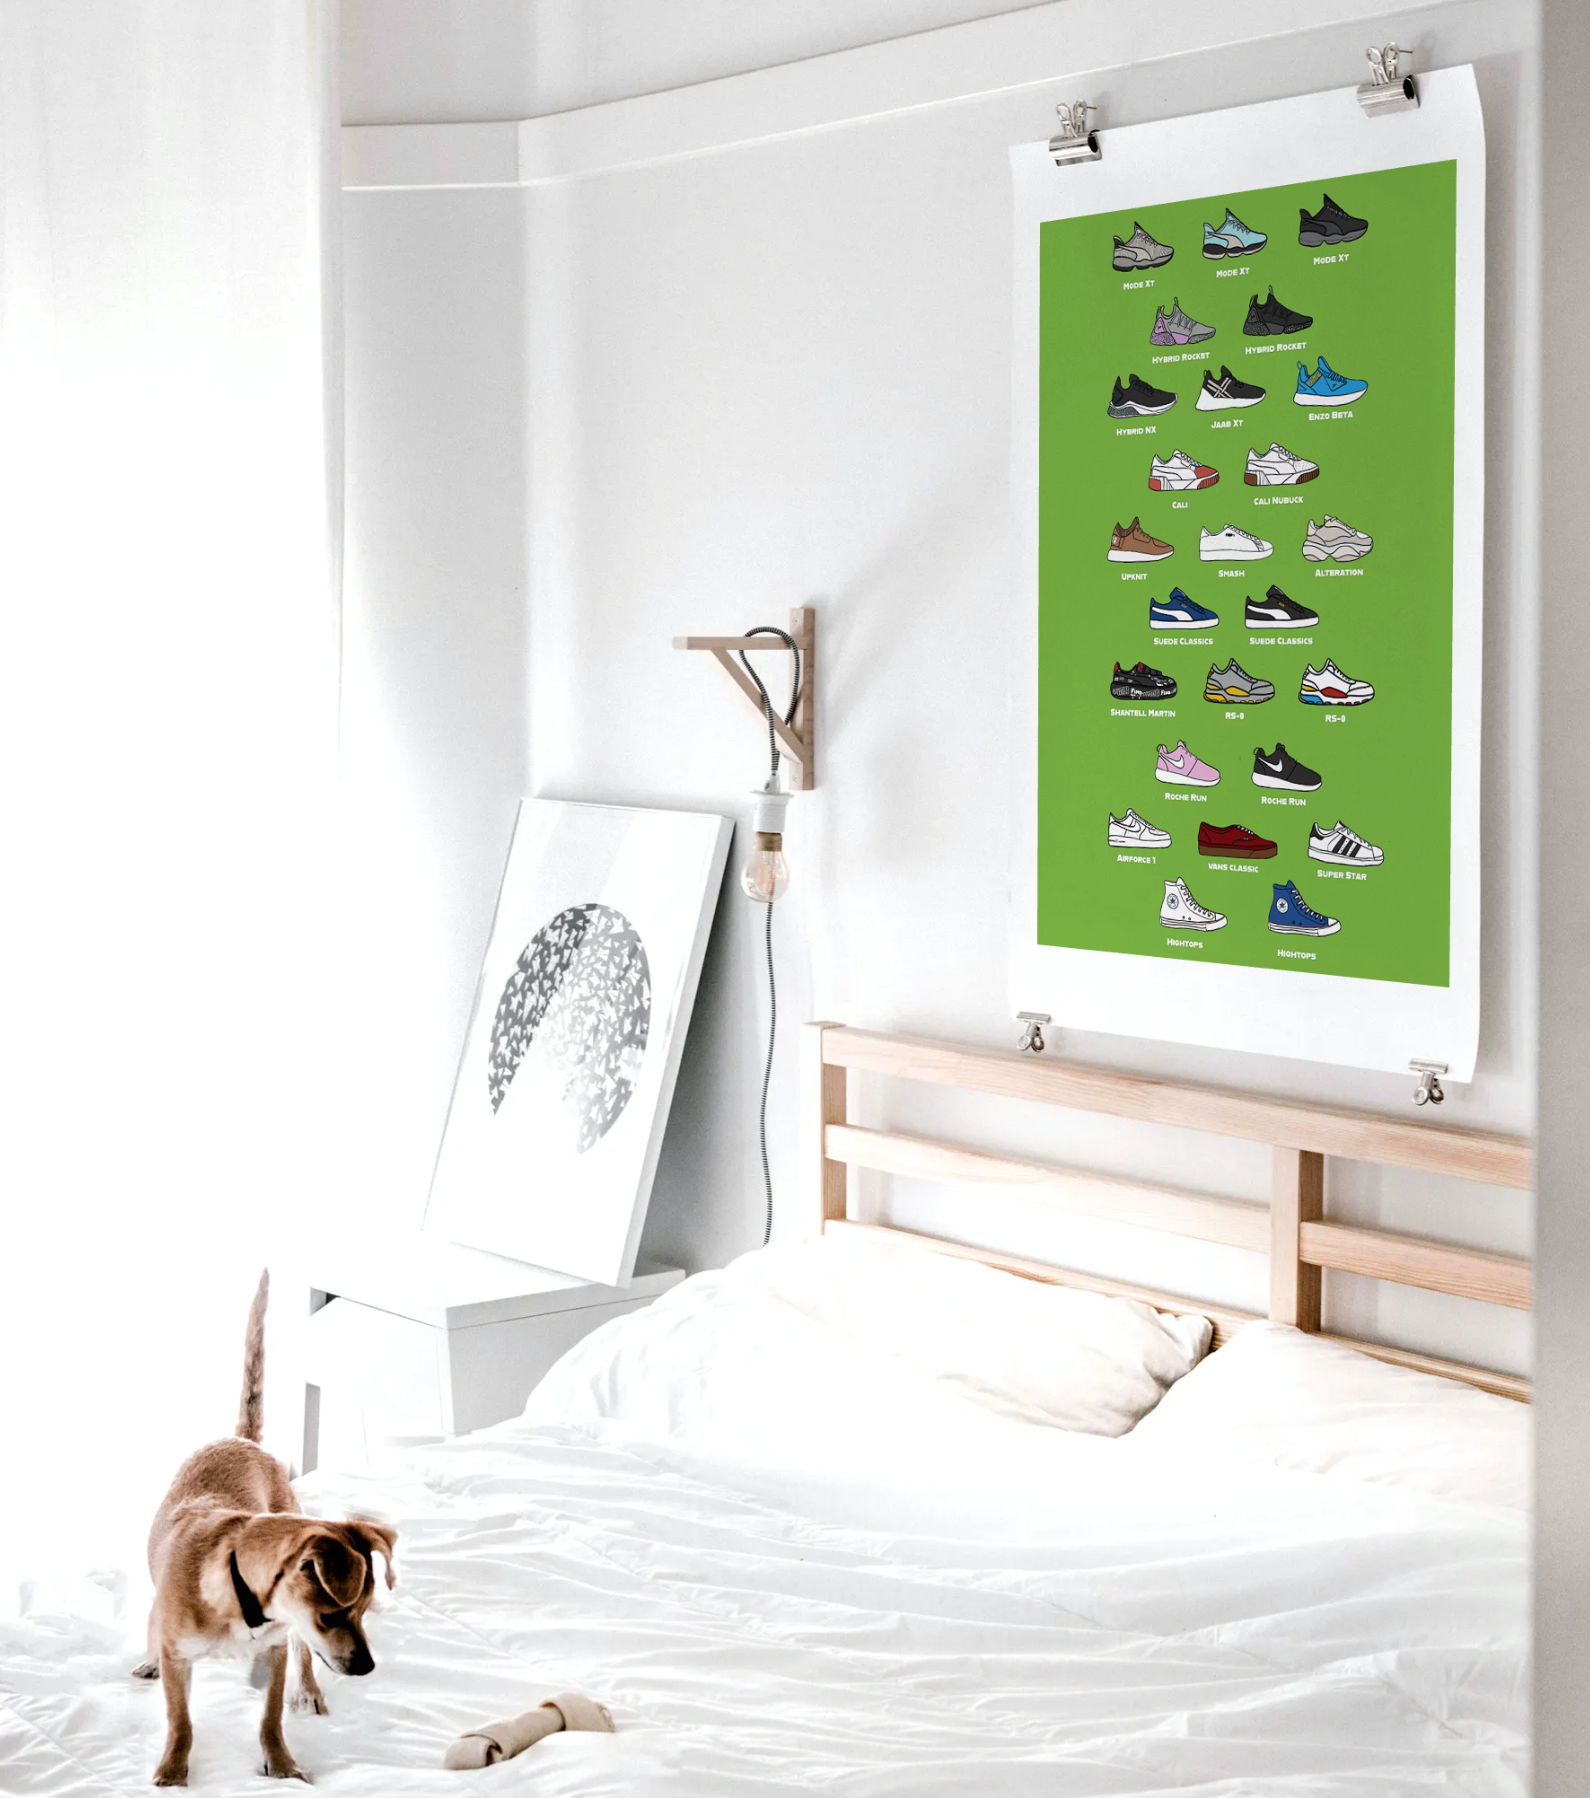
Final Product